


This article touches on programming and backpacking. Therefore, it's posted in two places. Once on my business blog, and again on my personal blog.
Introduction
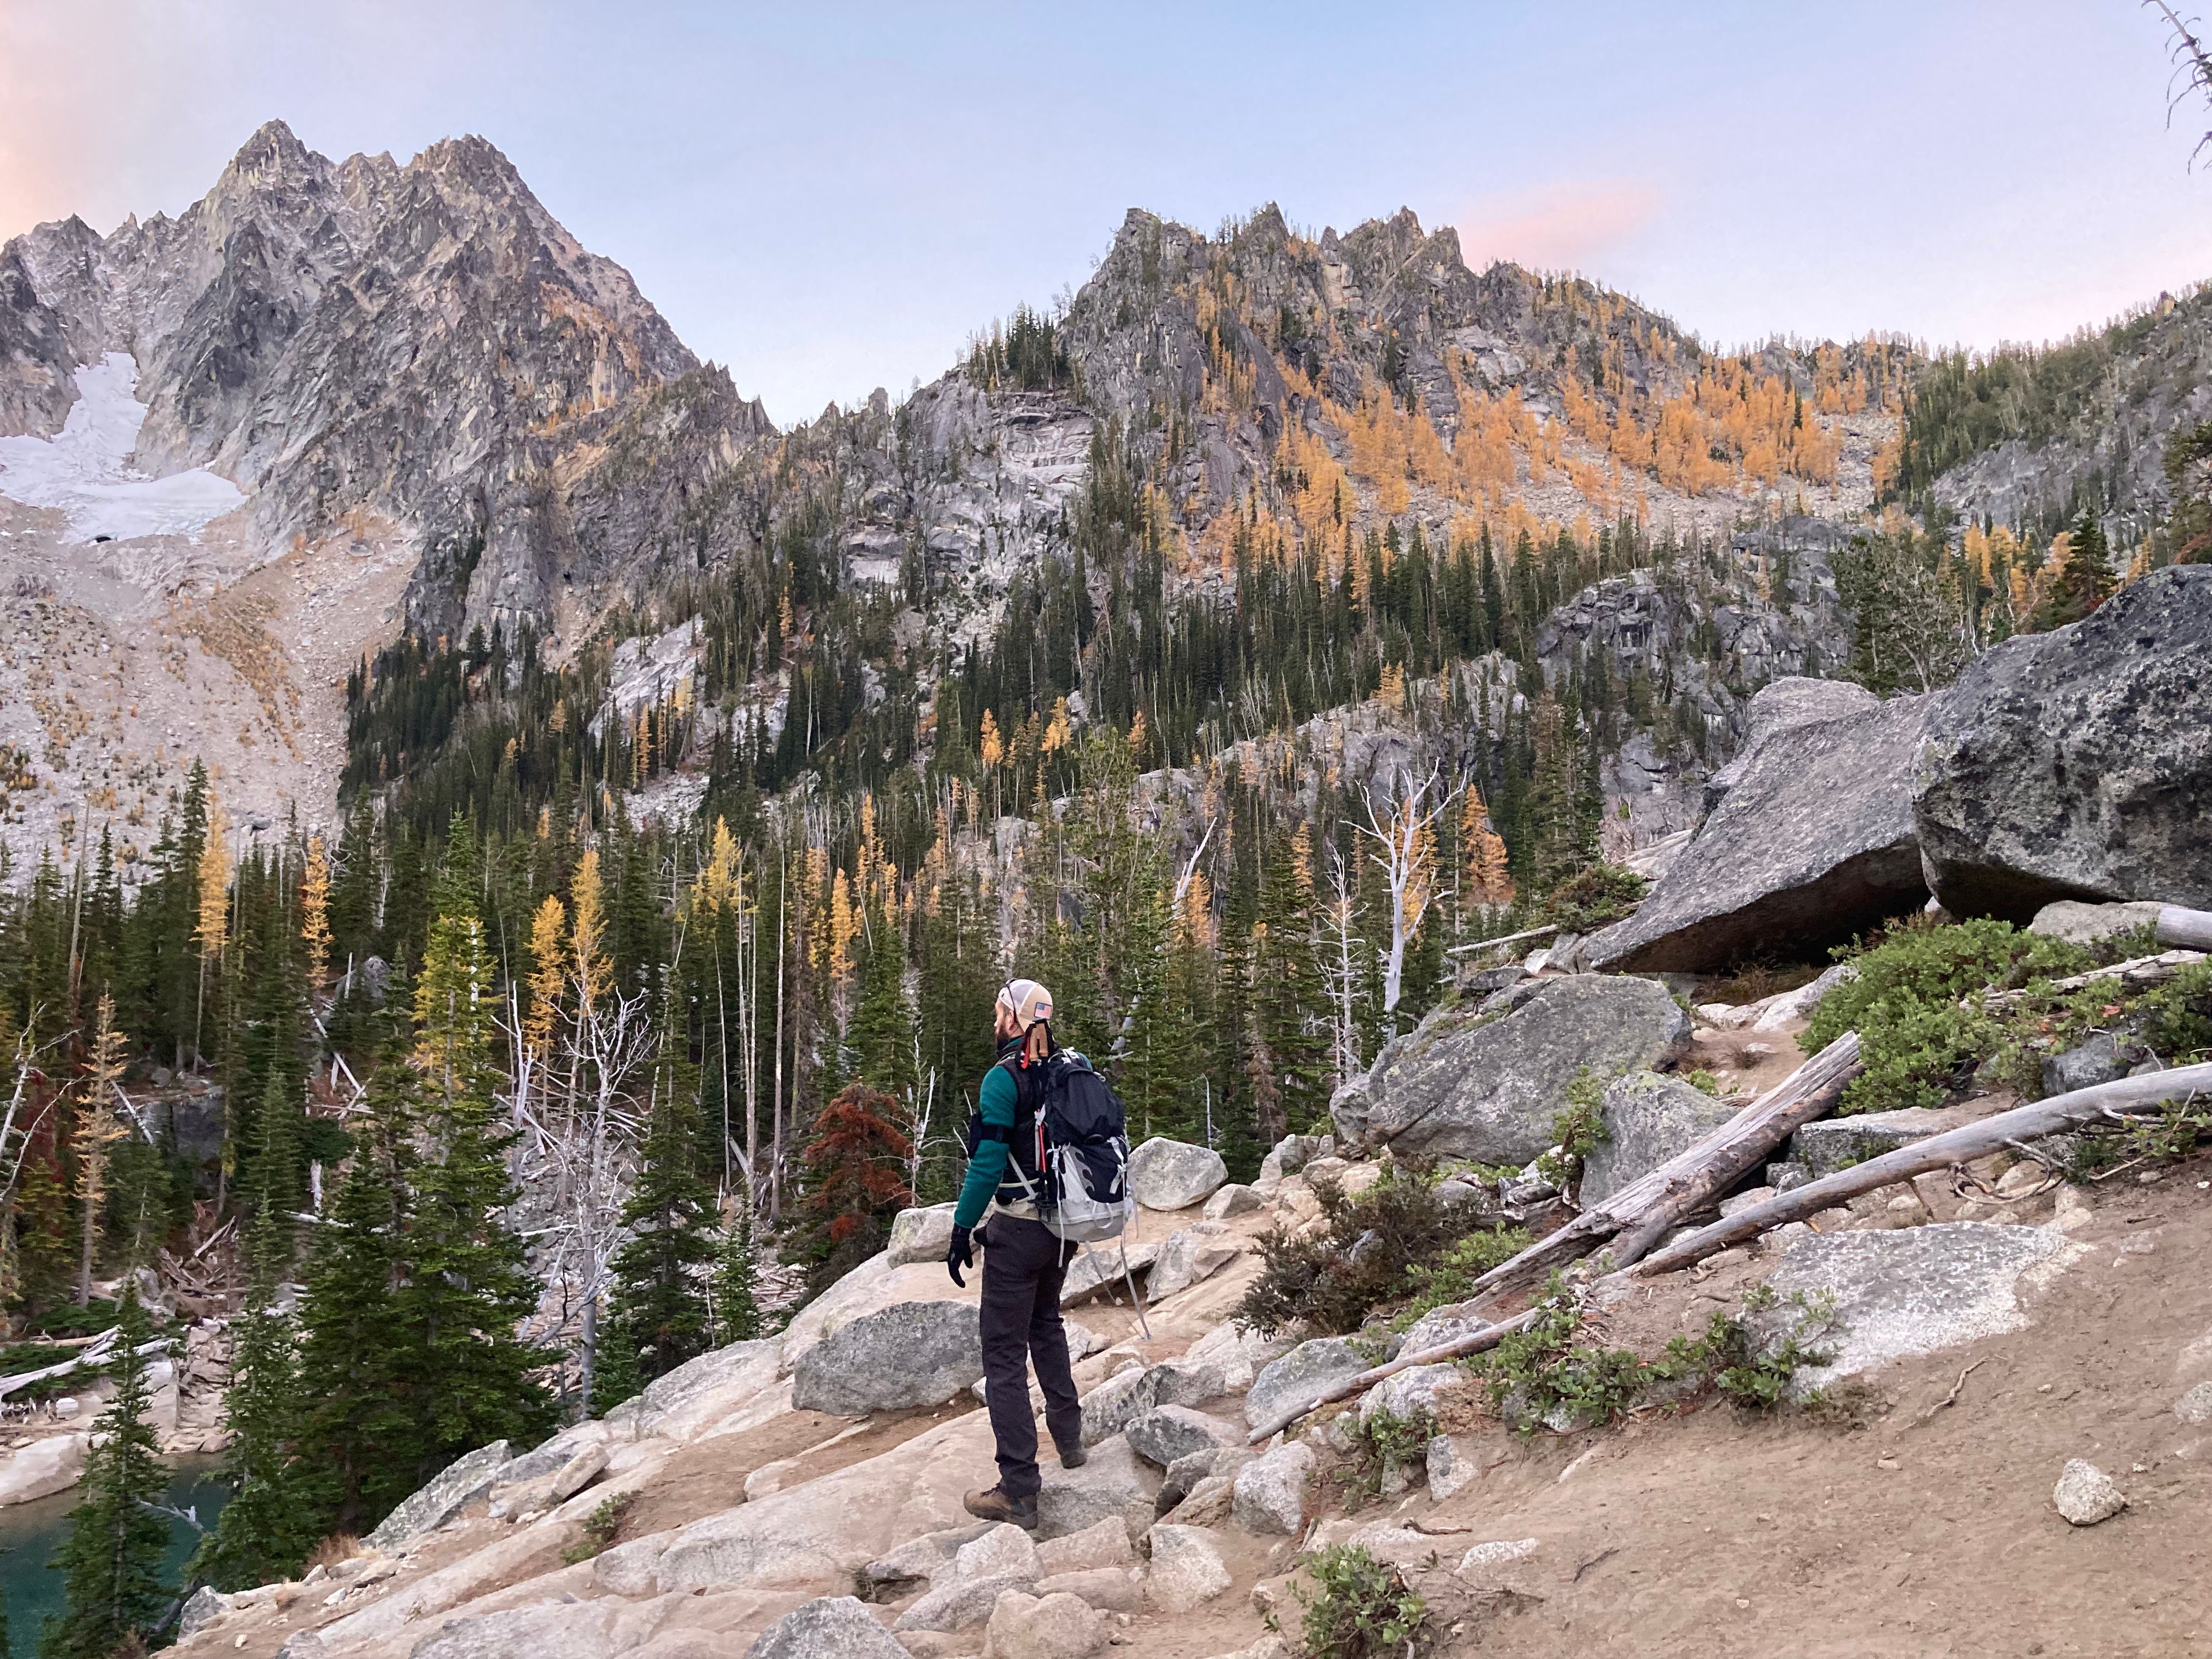
The winter is when I feel most eager to plan backpacking trips. When it's cold, icy, and dark it's comforting to think about the peaks, forests, and morning sun in the Cascades.
Similarly, it's time to submit applications for a chance to win a permit in one of the few lotteries in Washington State. The two permits I'm talking about are for:
This year, I revisited some statistics books from years ago and became curious about the probabilities, advice, and overall picture of the Enchantments Permit lottery. The Enchantments Lottery caught my attention because of how competitive it is, and the United States Forest Service publishes the lottery data on its website. I decided to download the 2021 lottery data files and double-check some of the intuitions I had and the gospel I've read on the internet.
This post summarizes some findings based purely on the zones people applied for. In the future, I hope to look at how entry date and group size affected lottery chances.
View the 2023 Enchantments Lottery analysis that includes information on the best months and days of the week to apply.
I have personally been unsuccessful in the Enchantments lottery on my three attempts.
What Do People Say?
In backcountry circles, information can make a big difference, whether it's hiking, skiing, biking, backpacking, fishing, or hunting—take your pick.
It goes a long way in determining where you go, when you go, what you do, and the experience you may have on your excursion. Therefore, it's no surprise people seek out helpful information to increase their chances of winning the Enchantments lottery. Whether it's online, on the phone, or in person there are certain claims about improving your lottery chances I wanted to look at using the published lottery statistics.
"You shouldn't apply for the Core Enchantments if you want to win"
I have personally repeated some variations of this statement. Purely based on my few failed attempts.
However, I'm not the only one who has spread this "advice". It didn't take much Googling to find others suggesting applicants should avoid applying for the Core Zone as well. In the online piece, The Enchantments Lottery: Best Ways to Win a Permit (2023), the author, Chris, took a look at the 2022 Enchantments results, stating:
The best way to win the Enchantments lottery is to apply for the Colchuck Zone or Snow Zone and avoid stiff competition for the Core Zone. Applying for a Monday, Tuesday, or Wednesday is your best bet at winning the permit lottery for the Core Enchantments Zone. August is the busiest month.
Chris, The Enchantments Lottery: Best Ways to Win a Permit (2023)
Similarly, in Ultimate Enchantments Lottery Guide: What to know for your 2024 trip, the author, Alec, says:
Everyone aims for the core zone. So, don’t aim for the core zone region if you want to win. Pick another section and go from there.
Alec, Ultimate Enchantments Lottery Guide: What to know for your 2024 trip
Both articles mention other ways to increase your odds, like applying during the week or not during peak season. We'll have to look at that advice another time.
Published Data from the USFS
My previous intuitions on whether or not to apply for the Core Zone were reinforced by the statistics summary published on the USFS website. As I'll discuss later, I think this judgment was a mistake.
The USFS is a great site where everyone should go first when planning an Enchantment trip. Not only does it have a ton of good information, it dabbles in statistical advice. In a section titled How can I improve my chances of getting a permit?, they say:
Because of the lottery, whether or not you are successful in getting a permit is partly luck. Bear in mind that the most popular time to go is August, and the most popular days to start a trip are Fridays, Thursdays, and Saturdays. If you really want to do a Friday-Sunday trip in mid-August, by all means apply for that trip, but remember that you’re odds of getting a permit will be less than if you tried for a Monday-Wednesday trip in July. View lottery statistics here
USFS, Enchantment Area Wilderness Permits
The Forest Service has published lottery data in a spreadsheet format for the years 2020, 2021, and 2022.
I made a few interesting observations on the statistics summary graphic for the year 2021:
- The Total Applications Submitted for the year 2021 is a typo. During my analysis, I calculated the total number of applications in 2021 at 36,695 (not 39,695). Furthermore, if you add up the numbers overlayed over each zone, you also get 36,695.
- I don't know how they got 2,444 Total Permits Awarded for the year 2021. In their spreadsheet, if you combine the applications with Accepted, Declined, and No Response in the "Awarded Status" column you get 2,445. It seems like a classic off-by-one error, but I'm not sure who is making it (them or me?).
- The statistics summary PDF breaks down the zones based on the applicant's "Preferred Division 1" column. Consequently, the number (27,061) of applications submitted in the Core Enchantment Zone for 2021 is actually, applications submitted with the Core Enchantment Zone as their first option.
In practice, someone could have been awarded a Core Zone permit having applied for a different zone as their first option, which is precisely what happened for 12 applicants in 2021.
For example, someone's preferred option 1 was the Colchuck Zone, and preferred option 2 was the Core Enchantment Zone. This application would be classified as a Colchuck Zone application on the statistics summary page.
This was just the start of my exploration into the statistics data for 2021. However, first, let's discuss the data.
Data
The published lottery data in 2021 has columns showing the dates and zones chosen by the applicant for each of their three options. It also has columns for the group size, results status, and the awarded details:
- Preferred Entry Date 1
- Preferred Division 1
- Minimum Acceptable Group Size 1
- Preferred Entry Date 2
- Preferred Division 2
- Minimum Acceptable Group Size 2
- Preferred Entry Date 3
- Preferred Division 3
- Minimum Acceptable Group Size 3
- Results Status
- Awarded Preference
- Awarded Entry Date
- Awarded Entrance Code/Name
- Awarded Group Size
Because the applicant only had to apply for one preference, many of the values for preferred options 2 and 3 were empty.
An example of an uncleaned data row for an applicant who only applied for one option and failed miserably is below.
Exploration
In 2021, 36,695 applications were submitted, which was a 60% increase from 2019 (24,614).
An application's status could be one of Unsuccessful, Accepted, Cancelled, No Response, or Declined. Therefore, you must add the Accepted, No Response, and Declined rows to get the total of awarded applications.
Results Status
Unsuccessful - 33800
Accepted - 2036
Cancelled - 450
No Response - 352
Declined - 57
Remarkably, 352 winners didn't respond to their winning applications in 2021! An astonishing 70 of those No Responses were for the Core Enchantment Zone.
Clean
To see how changes were made to clean the dataset, take a look at the cleaning file in the repository.
Analysis
Winning a Permit
After cleaning the data set, it was time to dive into an analysis. I started the analysis trying to discover the probability of being awarded a Core Zone permit given the applicant applied for at least one of their preferred divisions in the Core Zone. Conversely, this would allow me to compare an applicant's chances of winning any permit given they didn't apply for any Core Zone options.
First, let's look at an applicant's chances of winning any permit given they applied for at least one of their divisions in the Core Zone. Subsequently, this calculation also made it possible to calculate someone's chances of being awarded any permit given they didn't apply for any Core Zone options.
There was an 11.80% someone was awarded a permit given they didn't apply for any Core Zone options. We can compare that to a 6.76% someone was awarded a permit given they applied for at least one Core Zone option. You may be asking, how is this probability so high? I thought getting a permit was competitive for the Core Zone.
You're correct, it is more difficult to get a Core Zone permit. But this first analysis is looking at people who applied for at least one Core Zone option and were awarded any permit.
For example, consider someone's preferred option 1 was the Colchuck Zone and preferred option 2 was the Core Enchantment Zone and were awarded the Colchuck Zone. They would be considered as an awarded permit given they applied for at least one option for the Core Zone, despite being awarded the Colchuck Zone.
If you are concerned about winning, you have a higher probability of winning any permit if you don't apply for the Core Zone at all (11.80%). But, you still have a 6.76% of winning any permit if at least one of your options is for the Core Zone. Albeit, it may not be in the Core Zone. Still having a 6.76% chance of winning a permit isn't that daunting of a statistic, and it raises many questions about how people think about their odds in the Enchantments lottery. This observation had me thinking the competitiveness of the Core Zone shouldn't stop you from splurging on one of your entries and applying for the Core Zone. Still, you would need to hedge your bet by applying for other zones.
Unfortunately, the analysis is still on uneasy tread because someone who applied for at least one Core Zone and was awarded any permit is a lot different than someone who applied for at least one Core Zone and was awarded a Core Zone permit.
Winning a Core Zone Permit
Looking at the applicants who applied for at least one Core Zone permit, I found there was a 2.21% chance they were awarded a Core Zone permit. The odds here are much different than the odds in our previous section.
I think now is a good time to lay out my criticism of the advice given on whether or not to apply for the Core Zone permit (advice I have personally given.)
Saying you shouldn't try for a Core Zone if you want to win is lacking a data explanation. Is the claim based on a 1%, 2%, or 6% chance?
Often, it's helpful to know where the numerator and denominator came from to generate the probability. If you just look at the people who were awarded permits and divide that by the total awarded permits for the Core Zone, in 2021, you end up with a probability of 1.83% (673/36695). However, you can do the same calculation for Stuart Zone and end up with a 1.23% chance. So, is the Stuart Zone more competitive? No, it depends on how you look at the numbers.
Similarly, if you look at the total applications submitted in the Core Zone based on the USFS statistics page, and divide that by the number of permits, you get a probability of 2.48%. But, I've already pointed out the lottery doesn't work that way, and we need to look at everyone who applied for the Core Zone in any option. After making that distinction we have a probability of 2.21%.
We're almost at a good spot to stop for this exploration but we should look at the odds of winning a Core Zone permit if someone applied for only the Core Zone.
Applicants who applied for only the Core Zone saw their chances of landing a Core Zone permit (2.63%) increase by 0.42% compared to applicants who applied for at least one Core Zone option (2.21%).
The 2.63% chance includes applicants who applied for the Core Zone in some options while leaving the other options blank (N/A).
Conclusion
Most of the advice online appears to derive from unknown Enchantments lottery numbers. Let's make things clear here at the end, and anyone curious can take a look at the math in the provided repository.
Applicants who applied for at least one Core Zone option had a 2.21% of being awarded a Core Zone permit.
However, these applicants didn't miss out on winning permits in other zones. A total of 1,039 applicants were awarded permits other than the Core Zone despite applying for at least one Core Zone option. That makes up ~42.5% of the total permits awarded.
I want to state that again in other words. A total of 1,039 out of 2,445 applicants were awarded a permit for a zone other than the Core Zone despite submitting at least one option for the Core Zone.
A total of 673 people applied for the Core Zone and were awarded a Core Zone permit. Putting those numbers together we see that 1,712 people out of the 2,445 (70%) who were awarded permits, in 2021, applied for the Core Zone.
In an attempt to develop a cost-to-benefit comparison, applicants who applied for only the Core Zone saw their chances increase by less than half a percent (0.42%).
If you absolutely will only accept the Core Enchantment Zone, the half-percent increase is worth it. However, I think for most people it's better to include an option in your application for different zones. Which zone depends on many factors that you can only decide for yourself.
View the article on Statistics Based Strategies for Winning the Enchantments Lottery to see potential options based on these findings.
What's Next?
There's still a lot to parse in this data, and it's fun. I'd like to look at the odds of winning based on the time of the season and the day of the week. Hopefully, this will give us some better guidelines on truly increasing our chances.
I'll, maybe, try to combine these probabilities to show the best probability given an applicant's zone, day of the week, and time of year.
Afterword
It's not clear how the Enchantments lottery works. This lack of clarity is frustrating because it muddy the results of this probability analysis.
For example, we see which applications were Awarded, but we don't know which applications had a chance at being Awarded but were skipped over because the applicant's options were already taken. In other words, who had a chance at winning, but didn't? It would be prudent to at least ask the USFS or recreation.gov to explain the process in depth.
Later, I discovered how the lottery works and published the details in the article on statistics-based strategies for the Enchantments Lottery. If you're curious, visit the link and scroll down to the section, How the Enchantment Lottery Works.